


Unaudited share statistics
Analysis of shareholders at 30 June 2021
| Number of shareholders |
% of shareholders |
Number of shares |
% of total shareholding |
|
|---|---|---|---|---|
| Ordinary shares | ||||
| Size of holding | ||||
| 1 – 2 500 | 40 023 | 92,4 | 11 855 285 | 2,6 |
| 2 501 – 12 500 | 2 032 | 4,7 | 10 807 805 | 2,4 |
| 12 501 – 25 000 | 396 | 0,9 | 7 193 433 | 1,6 |
| 25 001 – 50 000 | 285 | 0,7 | 10 305 149 | 2,3 |
| 50 001 and over | 581 | 1,3 | 416 289 869 | 91,1 |
| 43 317 | 100 | 456 451 541 | 100,0 |
Major shareholders
Institutional shareholders
According to the register of shareholders at 30 June 2021, the following are the top 10 registered institutional shareholders:
| Number of shares |
% of total shareholding |
|
|---|---|---|
| Institutional shareholder | ||
| Public Investment Corporation | 54 558 649 | 12,0 |
| Coronation Asset Management | 39 326 295 | 8,6 |
| Foord Asset Management | 21 534 239 | 4,7 |
| BlackRock Inc | 17 235 125 | 3,8 |
| Sanlam Investment Management | 16 672 348 | 3,7 |
| The Vanguard Group Inc | 13 713 542 | 3,0 |
| Schroders Plc | 13 391 373 | 2,9 |
| Ninety One Plc | 12 618 671 | 2,8 |
| Allan Gray (Pty) Ltd | 10 476 538 | 2,3 |
| Westwood Global Investments LLC | 9 468 271 | 2,1 |
| 208 995 051 | 45,9 |
Top 10 beneficial shareholders
According to the register of shareholders at 30 June 2021, the following are the top 10 registered beneficial shareholders. The shareholdings of all directors are disclosed in the Remuneration review and implementation report, refer to the Remuneration implementation report in this Report.
| Number of shares |
% of total shareholding |
|
|---|---|---|
| Shareholder | ||
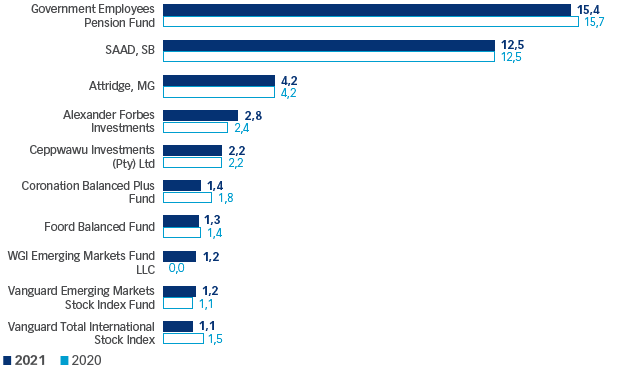
| Government Employees Pension Fund ("GEPF") | 70 426 943 | 15,4 |
| Saad, SB | 57 159 809 | 12,5 |
| Attridge, MG | 19 012 270 | 4,2 |
| Alexander Forbes Investments | 12 607 357 | 2,8 |
| Ceppwawu Investments (Pty) Ltd | 10 053 368 | 2,2 |
| Coronation Balanced Plus Fund | 6 232 211 | 1,4 |
| Foord Balanced Fund | 5 773 504 | 1,3 |
| WGI Emerging Markets Fund LLC | 5 597 400 | 1,2 |
| Vanguard Emerging Markets Stock Index Fund | 5 285 335 | 1,2 |
| Vanguard Total International Stock Index | 5 030 045 | 1,1 |
| 197 178 242 | 43,3 |
Shareholders' spread
As required by paragraph 8.63 and in terms of paragraph of 4.25 of the JSE Listings Requirements, the spread of the ordinary shareholding at close of business 30 June 2021 was as follows:
| Number of shareholders |
Number of shares |
% of total shareholding |
|
|---|---|---|---|
| Non-public shareholders | 12 | 148 097 015 | 32,4 |
| Directors of the Company and directors of material subsidiaries | 10 | 76 383 397 | 16,7 |
| Government Employees Pension Fund | 1 | 70 426 943 | 15,4 |
| Employee share trusts – treasury shares | 1 | 1 286 675 | 0,3 |
| Public shareholders | 43 305 | 308 354 526 | 67,6 |
| Total shareholding | 43 317 | 456 451 541 | 100,0 |
| Public shareholders (including the GEPF) | 43 306 | 378 781 469 | 83,0 |
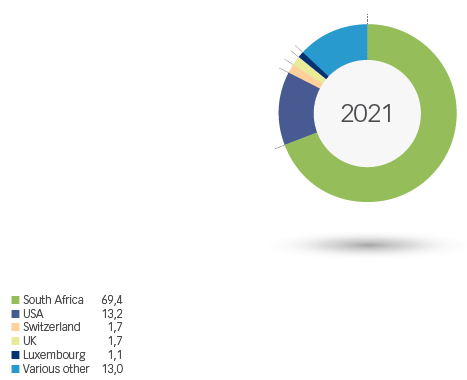
Beneficial shareholders – country (%)
Top 10 beneficial shareholders (%)
Institutional shareholders – country (%)
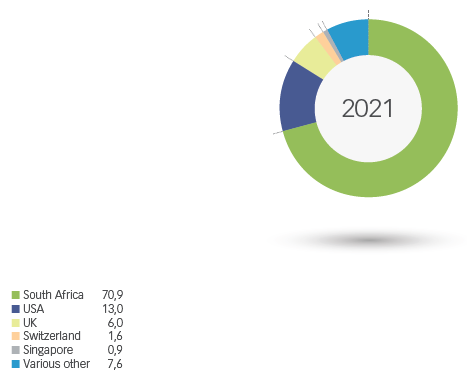
The geographical split of beneficial and institutional shareholders above is based on shareholders who own more than 25 000 Aspen shares.
Top 10 institutional shareholders (%)

Percentages for top 10 beneficial shareholders and top 10 institutional shareholders reflected above are as a percentage of the total issued share capital of the Company.