


Deputy Group Chief Executive's financial review

The Group has delivered double-digit organic revenue growth and sustained strong operating cash flows demonstrating agility and resilience during a period of difficult trading conditions. As we deliver on our strategic plan, our strong balance sheet provides optionality to invest in future growth opportunities.
Key features of 2021
Double-digit organic revenue growth
Group revenue increased 12% to R37,8 billion for the
year ended 30 June 2021, supported by growth from
Commercial Pharmaceuticals (+6%) and a pleasing
performance from Manufacturing (+36%).
Solid earnings growth
Normalised headline earnings per share increased
10% to 1 309,7 cents, benefitting from significantly
lower net financing costs.
Sharp reduction in borrowings
Net borrowings declined materially to R16,3 billion
as at 30 June 2021, a reduction of 54% over the level
of 30 June 2020, creating significant headroom in the
covenant leverage ratio.
Dividend reinstated as guided
Taking into account the earning and cash flow
performance for the year, existing debt service
commitments and future proposed investments and
funding options, dividends of 262,0 cents (gross) per
ordinary share declared.
Gus Attridge
Deputy Group Chief Executive
A year marked by delivery on our purpose and vision
Despite the ongoing challenges imposed by COVID-19, thanks to the untiring efforts of our employees, we have been successful in maintaining the reliable supply of our high quality medicines and products to patients globally. Our product portfolio has proven relevant in assisting to combat the effects of the virus on many patients in need and we have supplemented this contribution with the commencement of the production of Johnson & Johnson COVID-19 vaccines at our Gqeberha manufacturing site in South Africa.
Financial performance highlights
Revenue increased by 12% to R37,8 billion and normalised EBITDA increased 3% to R9,9 billion. The increase in revenue was supported by growth from Commercial Pharmaceuticals of 6% to R27,9 billion, despite the difficult trading conditions. A pleasing performance from Manufacturing was reflected in growth of 36%, boosted by the inclusion of transaction-related supply contracts. NHEPS increased by 10% to 1 309,7 cents, favourably impacted by lower financing costs.
Strong cash flows in the second half, supported by a positive cash inflow from the unwind of working capital, resulted in a cash conversion rate of 134%. Net borrowings declined R18,9 billion to R16,3 billion. The leverage ratio calculated in terms of the Facilities Agreement of 1,74 times was well below the covenant threshold of 3,5 times.
Our results separately disclose discontinued operations. These include the results of the discontinued European business, which comprised the European thrombosis assets divested to Mylan until the date of disposal (being 27 November 2020), the costs relating to its disposal, related thrombosis product discontinuations and other product divestments.
Our reported results are impacted by the rate of exchange prevailing during the period. The table which follows compares performance in the prior comparable period at previously reported exchange rates and then at CER. The CER results for the 12 months ended 30 June 2020 restate the performance for that period using the average exchange rates for the 12 months ended 30 June 2021. While fluctuations in exchange rates have been experienced over the reporting period, the overall weakening of the ZAR against the majority of the currencies in which Aspen trades has had a favourable impact on our reported results.
| 2021 R’million |
Restated 2020 R’million |
Change % |
2020 (CER) R’million |
Change (CER) % |
||
|---|---|---|---|---|---|---|
| Revenue | 37 766 | 33 659 | 12 | 34 395 | 10 | |
| Normalised EBITDA | 9 945 | 9 612 | 3 | 9 872 | 1 | |
| NHEPS (cents) | 1 309,7 | 1 194,8 | 10 | 1 222,4 | 7 |
Business segment performance
Resilient performance in Regional Brands and strong delivery from Manufacturing contributes to increase in revenue despite COVID-19 challenges
Revenue increased by 12% (+10% CER) to R37,8 billion. The Commercial Pharmaceuticals business, comprising Regional Brands and Sterile Focused Brands, increased revenue by 6% (+4% CER) to R27,9 billion. Regional Brands delivered a sound performance, increasing revenue by 3% (+2% CER) to R17,2 billion, notwithstanding the negative impact from the pricing adjustment to the European oncology products and the lower COVID-19-related demand for certain therapies within this portfolio. The performance of the Sterile Focused Brands segment was buoyed by the increase in demand for brands used in the clinical management of COVID-19 in certain territories, but this positive performance was offset by the impact of the postponement of elective surgeries in others. An overall increase of 11% (+9% CER) in revenue to R10,7 billion was delivered by this segment. Manufacturing delivered a strong performance, increasing revenue by 36% (+29% CER) to R9,9 billion, supported mainly by the supply of products to the counterparties of recent transactions and the commencement of production of the Johnson & Johnson COVID-19 vaccine at the end of the third quarter of the financial year. Excluding the transaction-related sales, Manufacturing revenue was up 12% (+7% CER).
| 2021 R’million |
Restated 2020 R’million |
Change % |
2020 (CER) R’million |
Change (CER) % |
||
|---|---|---|---|---|---|---|
| Commercial Pharmaceuticals | 27 874 | 26 366 | 6 | 26 734 | 4 | |
| Regional Brands | 17 183 | 16 751 | 3 | 16 919 | 2 | |
| Sterile Focused Brands | 10 691 | 9 615 | 11 | 9 815 | 9 | |
| Manufacturing | 9 892 | 7 293 | 36 | 7 661 | 29 | |
| API (Chemicals) | 5 154 | 4 799 | 7 | 5 032 | 2 | |
| API (Biochemicals) | 1 243 | 1 116 | 11 | 1 183 | 5 | |
| FDF | 3 495 | 1 378 | >100 | 1 446 | >100 | |
| Group revenue | 37 766 | 33 659 | 12 | 34 395 | 10 |
Changes in sales mix to Manufacturing and increased production costs under COVID-19 weighed on gross profit percentage
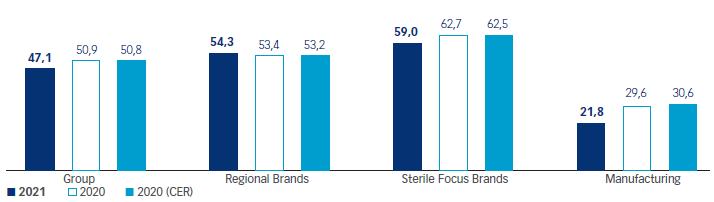
Our gross profit percentage showed a decline from 50,9% (50,8% CER) to 47,1%. Manufacturing gross profits were diluted by the inclusion of transaction-related supply at low to no margin, while the increased costs of operating under COVID-19 conditions also weighed on performance. Regional Brands profit margin was negatively impacted by the European Union oncology price cuts, but nevertheless was able to show some improvement through the realisation of cost savings. Gross profit percentages in Sterile Focus Brands trended lower due to changes in product mix. Overall, the increased proportion of Manufacturing revenue of total Group revenue has resulted in a lower Group gross profit percentage.
Gross profit by business segment (%)
Normalised EBITDA margin percentage diluted by lower GP% and reduced operating income
Normalised EBITDA increased marginally to R9,9 billion, with well-controlled operating expenses offsetting the decline in gross profit percentage and a reduction in other operating income. Other operating income dropped largely due to the non-recurrence of a milestone received in the prior year related to the performance arrangements with a distributor of our products in the USA.
| 2021 R’million |
% of revenue |
Restated 2020 R’million |
%
of revenue |
Change % |
2020 (CER) R’million |
% of revenue |
Change (CER) % |
||
|---|---|---|---|---|---|---|---|---|---|
| Gross profit* | 17 789 | 47,1 | 17 135 | 50,9 | 4 | 17 475 | 50,8 | 2 | |
| Operating expenses | (9 124) | (24,2) | (8 891) | (26,4) | 3 | (9 017) | (26,2) | 1 | |
| Net other operating income | 237 | 0,6 | 428 | 1,3 | (45) | 449 | 1,3 | (47) | |
| Depreciation | 1 043 | 2,8 | 940 | 2,8 | 11 | 965 | 2,8 | 8 | |
| Normalised EBITDA | 9 945 | 26,3 | 9 612 | 28,6 | 3 | 9 872 | 28,7 | 1 |
* Gross profit is after the deduction of depreciation
Earnings growth positively impacted by reduction in net funding costs
Normalised headline earnings, which adjusts for specific non-trade items as set out in our accounting policies, is the primary measure management uses to assess our underlying financial performance. Normalised headline earnings of R6,0 billion was 10% (+7% CER) higher than the R5,5 billion achieved in the prior year, positively impacted by the slightly increased EBITDA and a significant reduction in normalised net funding costs.
With no change in the issued share capital, NHEPS also increased by 10% (+7% CER) to 1 309,7 cents per share.
Set out below is a reconciliation of earnings per share at the basic, headline and normalised headline levels.
| 2021 Cents |
Restated 2020 Cents |
Change % |
2020 (CER) Cents |
Change (CER) % |
||
|---|---|---|---|---|---|---|
| Basic earnings per share | 1 051,1 | 740,5 | 42 | 749,6 | 40 | |
| Impairment of property, plant and equipment | 29,1 | 1,8 | 1,8 | |||
| Impairment of intangible assets | 274,8 | 280,6 | 296,1 | |||
| Impairment of financial assets | — | 2,0 | 2,0 | |||
| Impairment of goodwill | 27,8 | 21,1 | 22,4 | |||
| Reversal of impairment of IP | (90,2) | — | — | |||
| Reversal of impairment of PPE | (59,5) | (0,3) | (0,4) | |||
| Profit on sale of assets classified as held-for-sale | — | (3,1) | (3,3) | |||
| Profit on sale of intangible assets | (28,8) | (44,5) | (47,4) | |||
| Headline earnings per share ("HEPS") | 1 204,3 | 998,1 | 21 | 1 020,8 | 18 | |
| Restructuring costs | 63,7 | 67,4 | 67,8 | |||
| Transactions costs | 49,2 | 88,1 | 89,8 | |||
| Product litigation costs | 9,1 | 44,9 | 47,7 | |||
| Foreign exchange gain relating to transactions | (16,6) | (3,7) | (3,7) | - | ||
| Normalised HEPS | 1 309,7 | 1 194,8 | 10 | 1 222,4 | 7 |
Working capital and cash flow
Continued focus on optimising investment in net working capital
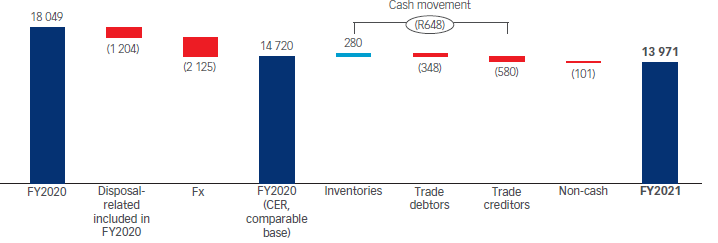
Our efforts to reduce our investment in net working capital, while maintaining appropriate levels of inventory to ensure continuity of supply, have continued to deliver positive outcomes. After taking into account the foreign exchange effect and the reduction associated with the divestments during the period, net working capital levels decreased by 5% (CER) over the prior year, reducing the investment in working capital to 37% of revenue from 43% (CER) reported in the prior year, the lowest point achieved since our transition to a global multinational. Our working capital levels are influenced by the long working capital cycle associated with our Oss API business, and excluding this business, working capital reduces to 31% of revenue.
Net working capital bridge (R’million)
Strong operating cash flow maintained
Strong operating cash flows were enhanced by a reduction in working capital for the second consecutive year and lower net finance costs. Cash generated from operating activities of R6,8 billion represents operating cash flow per share of 1 463,2 cents and a 134% conversion of headline earnings to cash.
Non-current asset optimisation
While some strategic projects came online, high levels of investment in our manufacturing capabilities continues
The extensive capital expenditure programmes at our Gqeberha, Notre Dame de Bondeville and Bad Oldesloe sites have continued, with the restrictions imposed by COVID-19 resulting in some unavoidable delays. Commercial manufacture for certain products at our Gqeberha and Bad Oldesloe sites has commenced and will continue to ramp up over the next two years. Commercial production at Notre Dame de Bondeville is expected to commence in FY2023.
Based on our approved capital expenditure projects, expenditure on property, plant and equipment ("PPE") is expected to amount to approximately R2,0 billion in FY2022, reducing to R1,6 billion in the next year. As we progress our vaccine manufacturing strategy, further investments in expanding our capacity will be considered.
Divestment of European thrombosis assets key to strategic reshaping of the Group
In line with our strategic intent to achieve focus on our core pharmaceutical business in territories where we have sufficient scale, we have divested the assets related to the commercialisation of our thrombosis products in Europe to Mylan. The total purchase consideration (inclusive of inventory) was EUR680 million (R12 491 million) and was used to further reduce our borrowings.
Impairment to intangible assets and goodwill
We classify certain of our intangible assets as being of indefinite life. Each year the carrying values of the intangible assets and goodwill are rigorously tested for impairment and carrying values are written down where there has been a reduction in value. Intangible assets which are no longer assessed as indefinite life are reclassified as definite life assets. This year, net impairments of intangible assets and goodwill were R1,0 billion on a total combined net book value of R59,5 billion at financial year-end.
Funding and debt profile
Significant headroom on covenant leverage ratio
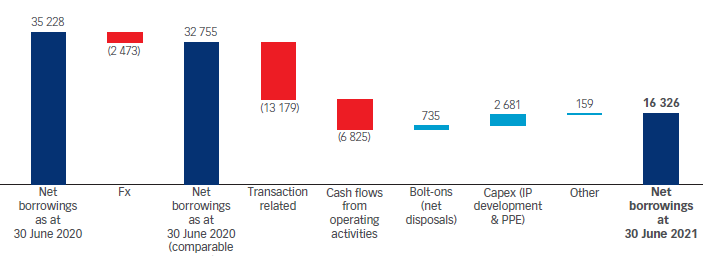
The positive cash flows achieved together with the proceeds from the disposals have been utilised over the year to reduce the level of net borrowings by R18,9 billion to R16,3 billion. The leverage ratio of 1,74 times is well within the covenant level of 3,5 times and below our internal target of 3,0 times.
Leverage ratio (times)

Restructuring of debt maturity profile
Our existing EUR, ZAR and AUD syndicated term debt facilities were, as of 30 June 2021, scheduled to mature on 1 July 2022. Subsequent to year end, we have secured an extension of maturity dates to 30 June 2023.
We were also successful in securing a joint refinancing package from the IFC and a consortium of development finance institutions related to the IFC. The debt financing package is for an aggregate of EUR 600 million and is structured as an amortising loan, with a two-year grace period and with the final loan instalment being due up to seven years after its effective date. The further funding terms are substantially similar to our existing EUR-denominated syndicated debt facilities agreement. The proceeds from this funding will be used to refinance a portion of our existing EUR-denominated syndicated debt facilities, thereby increasing our loan tenor and further diversifying our debt funder base.
Net borrowings (R’million)
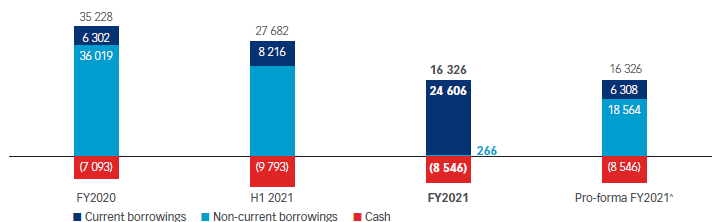
^ Pro-forma maturity profile post extension and IFC refinancing package (seven-year amortising term)
2021FY2021Net borrowings bridge (R’million)
Net funding costs (continuing operations)
The lower net borrowings have contributed to a 29% reduction in net financing costs.
| 2021 R’million |
2020 R’million |
Change % |
||
|---|---|---|---|---|
| Net interest paid | (854) | (1 314) | ||
| Foreign exchange (losses)/gains | (49) | (8) | ||
| Notional interest on financial instruments | (211) | (182) | ||
| Normalised net funding costs | (1 114) | (1 504) | (26) | |
| Debt raising fees on acquisitions | (47) | (45) | ||
| Foreign exchange gains on acquisitions | 78 | 17 | ||
| Reported net financing costs | (1 083) | (1 532) | (29) |
Continued improvement in financial reporting systems and internal financial control assessments
During the year, we have progressed our digitalisation strategy and have invested heavily in new ERP systems and advanced technology. These projects remain integral to our objective of achieving significant improvement in the quality, timeliness and depth of financial and tax reporting available to the Group. We also strengthened our management assurance processes over internal financial controls through rigorous control self-assessment declarations provided by the financial head of each subsidiary, while the Group Internal Audit function provided additional assurance on the design and operating effectiveness of all key internal financial controls. Our robust processes provide support for our assertion that there were no material breakdowns of internal financial controls underpinning the financial results.
Capital allocation according to prioritisation model
In order to ensure an effective allocation of available capital, the Board has approved a prioritisation model that defines the balance between ensuring business sustainability and efficiency, catering for transactional activity inherent in product portfolio renewal, providing guidance to our shareholders on dividends as well as supporting larger acquisitions and disposals that are value accretive - all subject to the pre-condition that our net borrowings remain within the threshold leverage cap of no more than 3,0 times. Taking into account the earnings and cash flow performance for FY2021, the existing debt levels as well as amounts already invested and committed, the Board has resumed the payment of dividends with a declaration of a gross dividend of 262 cents per ordinary share which was paid to shareholders registered in the share register as at 23 September 2021.
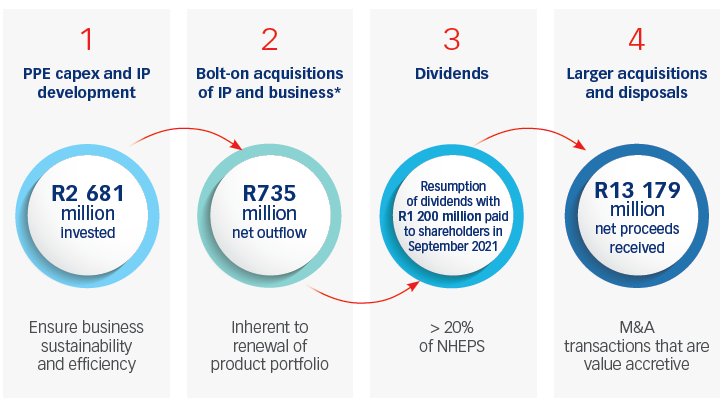
* Limited to a net transaction value of R1 billion per annum from bolt-on acquisitions and disposals
Rotation of external auditors
The Audit & Risk Committee embarked on a comprehensive process to affect the controlled rotation of the Group's external auditors and this culminated in the appointment of EY as the Group's auditors for FY2021. The rotation of external auditors is not without significant effort and I wish to thank the financial teams across the Group as well as the incoming EY team for achieving a successful transition notwithstanding the restrictions to on-site engagement imposed during the pandemic. I would also like to acknowledge the contribution of PwC to the Group over the years it diligently served as our external auditor.
Appointment of Group Chief Financial Officer
After 22 years in the role, I have announced my retirement as Deputy Group Chief Executive (and Financial Director) effective 31 December 2021. Following a thorough selection process, the Board has appointed Sean Capazorio as the Group Chief Financial Officer, effective 1 January 2022. Sean joined Aspen in 1999 as a consequence of our acquisition of South African Druggists and I have worked alongside him through the phenomenal transformation of the Group to a multinational corporation. Sean has proven himself over many years to be highly skilled and extremely capable, also bringing with him deep institutional knowledge and very relevant experience. I am sure the whole of the Aspen Group joins me in wishing him every success in his new leadership role.
Looking ahead
While the evolving impact of COVID-19 continues to create uncertainty, our focus remains firmly on positioning the business for sustainable growth through implementation of our strategic plan. The cornerstones of this plan are achieving organic growth in Commercial Pharmaceuticals, growing the contribution from the Manufacturing business by introducing new customers to utilise the additional sterile manufacturing capacity we have created, and improving the EBITDA margin percentage by increasing efficiencies, tight expense control and in-housing of the production of a material portion of our anaesthetics products. These pillars are supported by a proven track record of strong operating cash flows and a solid balance sheet with significant capacity to fund investment opportunities that support the strategy.
In FY2022, we will benefit from the continued production of the COVID-19 vaccine with the exciting possibility of securing a licence from Johnson & Johnson to manufacture, market and sell an Aspen-branded COVID-19 vaccine for Africa. The targeted reshaping of our Commercial business over the past few years, together with our continued focus on developing and evolving our product portfolio, is expected to yield benefits reflected in a continuation of the solid organic growth delivered in FY2021. NHEPS will be positively impacted by further anticipated reductions in finance costs. We will continue to focus on generating positive free cash flows and we anticipate again achieving our operating cash conversion target of at least 100%. Should our assessment of the offers made for our API business translate into a completed disposal of this business, we will have the luxury of even greater flexibility in the options we have to allocate capital. The performance of the Rand against the basket of Aspen's trading currencies may impact our reported results.
Closing remarks
It has been a most gratifying experience to have been able to serve as a director of Aspen from inception of the business. In this time we have achieved more than we ever dreamed of at the outset, and I believe, Aspen stands as a great example of what can be achieved by committed pursuit of a vision, by believing in the art of the possible and by not being deflected by naysayers. To have been able to improve the lives of so many patients across the globe and to have been able to contribute to the economic growth of South Africa have been personal highlights. It has been my pleasure to work with so many exceptionally talented people over these years, united in our common values and objectives. I have benefitted from outstanding support, not only from my colleagues at Aspen, but also from our investors, funders, business partners and service providers, for which I am most grateful. To the many who have guided me and helped me to grow as a person, my appreciation. It has been my honour and privilege to serve alongside Stephen for the entire journey; we have shared many highs and some lows, and throughout he has been an inspiration and a trusted ally; my deep thanks to him for the amazing experiences.
Aspen is in great shape and with Stephen's visionary leadership, the wise counsel of our Board, the direction of our highly skilled executive team and the implementation of our dedicated employees, an exciting future lies ahead. I am looking forward to playing a part in realising this potential in my new role, mentoring and supporting the leadership team.
Gus Attridge
Deputy Group Chief Executive